.. and using Kibana to display the data


(yes, I woke up at noon that day. So what?)
Why ?
Winter was coming and I my living room was never at the right temperature — either too cold, or too hot. Or so I thought, since I had no way to tell (no thermometer at hand). I wanted to have a good insight on how the temperature was fluctuating in the room and moreover I wanted to be able to know if it was more efficient to leave the heating on when I'm not home to keep a constant comfy temperature or to leave it off and heat more when I went home at night.
Existing devices
Of course a lot of devices already exist for that purpose : some really nice commercial ones such as the Netatmo thermostat, or Google Nest for instance, or even a Home Energy Meter from Aeon Lab.
Open source initiatives exist as well, like OpenEnergyMonitor.

(image courtesy OpenEnergyMonitor)
But I wanted to build it all myself from scratch:
- first and foremost to be able to understand how to build such a device,
- because I wanted to be able to process the data the way I wanted,
- and finally because I really wanted the device to fit in my electrical panel (this kind of panel)
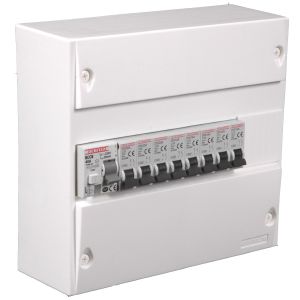
0. So, what do we build ?
Let's note down what our device should do:
- sense the temperature
- calculate the instantaneous mains current
- send this data over WiFi at a fixed interval
- (optionally) display the temperature on the device
- (optionally) display the power consumption in realtime
So I went on and built a first prototype. First things first : let's start building the electronics.
1. The electronics
I decided to base everything off the Arduino UNO since it's easy to program and has an easy mounting shield interface. It's clearly not the smallest device (I could have used a Nano or a Pro but at the prototype stage, I didn't feel confident I would easily manage to connect everything).

(image courtesy arduino.cc)
For the network connectivity, we add a WiFi shield, with a Texas Instruments CC3000 IE802.11b/g module that seem quite common, like on this one from Adafruit :

(image courtesy adafruit.com)
As for the rest, we need : a non-invasive current sensor, for example this one from Sparkfun :

(image courtesy sparkfun.com)
And some displays : a 7-segment to display the temperature, and a led strip (8 leds) to display the power consumption relative to the max power allowed for my installation.

(images courtesy adafruit.com)
To get a reading out of the current sensor, we need to add a burden resistor to read a voltage instead of a current, and shift the voltage to an acceptable 0 -> 5V range or the Arduino ADC. Here is a little diagram to show how to connect everything together :

(image courtesy some site I can't remember — if you're the author, let me know :) !)
The Bill Of Materials is as follows :
| Element | Where to find it |
|---|---|
| Resistor | Hardware shop or Sparkfun |
| 1x 1000µF capacitor | Hardware shop or Sparkfun |
| 1x 10µF capacitor | Hardware shop or Sparkfun |
| 2x 10kΩ resistor | Hardware shop or Sparkfun |
| 2x 200Ω resistor | Hardware shop or Sparkfun |
| 1x 47Ω resistor | Hardware shop or Sparkfun |
| 1x Stereo TRS connector (jack 3.5mm) | Hardware shop or Sparkfun |
| 1x JST connector 3pin and 1x JST connector 4pin | Hardware shop or Sparkfun |
| 1x antenna (U.FL connector) | Hardware shop or Sparkfun |
| 1x TMP36 temperature sensor | Hardware shop or Sparkfun |
| Multi-strand wires | Hardware shop or Sparkfun |
| Some pin headers | Hardware shop or Sparkfun |
A note on how we calculated the burden resistors values :
In the primary coil, the peak current is :
peak_current_primary = MAX_CURRENT * sqrt(2)
so in the secondary coil, we have :
peak_current_secondary = peak_current_primary / NB_TURNS
and we know we have 2000 turns on the sensor. The Arduino is roughly running at 5V, so
VCC = 5000; // in mV. Or readVcc(), see later
so
burden_resistor_value = ((VCC/1000.0) / 2) / peak_current_secondary
For a max current of 15A (3kW at 230V), we have
235Ωwhich is close to a standard value of247Ω— a double check here
Ta-da! :

(Maybe I should round that 24.98°C up ...)
Now, let's have a look at the Arduino code structure. We need different routines : code for the WiFi module, code for reading the sensors value, code for displaying everything and sending it out.
The whole code is available here on github and is conveniently divided into files for readability. Some interesting bits :
a readVcc() function to get more accurate readings, thanks to Matt and Jérôme, which boils down to :
 // (...)
delay(2);                    	// Wait for Vref to settle
ADCSRA |= _BV(ADSC);             // Convert
while (bit_is_set(ADCSRA,ADSC));
result = ADCL;
result |= ADCH<<8;
result = 1126400L / result;  	// 1100mV*1024 ADC steps
return result;
a reset function used to reboot the Arduino when the WiFi crashes :
void(* resetFunc) (void) = 0;
The calcIrms() function is almost directly taken from the OpenEnergyMonitor library here, thanks guys !
2. A custom PCB
To include all the components seen on the previous picture, I thought a custom PCB would be great.
I used Fritzing again (and Fritzing Fab) to design and produce the board. The design is not very difficult (and, to be honest, not very well thought, but hey), it's just an attempt to put everything on a board with connectors (JST) to allow for plugging/unplugging the displays.

You can see that the pin headers are offset : that is because I soldered the corresponding pins with an offset as well on the WiFi shield. Not a necessity though, just a choice.
3. Server-side : process the data
I already have an ELK stack that process all my server logs and a nice dashboard for the sanity of the whole infrastructure. I use it a lot, and it seemed a good platform to send the data to, as it is quite made for this kind of time series.
So I decided to give it a try.
First mission : get the data and store it nicely for logstash
Logstash knows how to reads log file, so let's write a log file !
I fired up a text editor and created a little node.js app that would get the requests and process them.
As per the Arduino code, the request coming is something like :
POST /api/endpoint HTTP/1.1
Content-Type: application/x-www-form-urlencoded
Content-Length: XX
key=myPriVaTeKey&t=22.1&w=1340
Express is perfectly fit to easily create a simplistic app that will take care of all that :
// We have defined a config object beforehand
app.post(config.PATH, function (req, res) {
  if (req.body.key == config.PRIVATE_KEY) {
    temperature = req.body.t
    power = req.body.w
    date = new Date().toISOString().replace(/T/, ' ').replace(/\..+/, '').replace(/-/g, '\/')

    var log_message = date + " " + temperature + " " + power

    fs.appendFile(config.LOG_FILE, log_message + "\n", function (err) {
      if (err) {
        res.json({ code: 0 })
      } else {
        res.json({ code: 1 })
      }
    });
  }
})
The log file would thus basically be like this :
2015/03/03 20:34:13 21.2 71
2015/03/03 20:34:17 21.2 72
2015/03/03 20:34:22 21.2 71
2015/03/03 20:34:26 21.2 71
Second mission : process the data in logstash
To process the log in logstash, we're going to create a little grok rule, and duplicate the logs using ruby since we need a log line per figure to make kibana behave :
First, we tag the incoming data :
input {
  file {
    path => "/var/log/energy/energy.log"
    type => "energy"
  }
}
Then, we filter it out and clone each log line. The aim is to create a common pattern for all lines, with the value (energy or temperature) stored under a common "value" key :
filter {
  if [type] == "energy" {
    # Extracts the values
    grok {
      match => { "message" => "(?<timestamp>%{YEAR}/%{MONTHNUM:month}/%{MONTHDAY:day} %{TIME}) %{NUMBER:temperature:float} %{NUMBER:power:float}" }
    }
    # Gives it a type first
    mutate {
      update => [ "type", "temperature" ]
    }
    # Clones the event
    clone {
      clones => ["power"]
    }
  }
  ruby {
    code => "
        if event['type'] == 'temperature'
            event['value'] = event['temperature'].to_f
        elsif event['type'] == 'power'
            event['value'] = event['power'].to_f
        end
    "
  }
}
Our logs now get nicely into Elasticsearch. Yeah !
Third mission : create a nice dashboard
Now that is quite an easy task since all the hard work has already been done. Some charts and a nice trend graph, and boom :

4. Casing
Now for some hardware design !
We have quite a bunch of constraints to take into account: The DIN-rail (a standard for circuit-breakers inside electrical box), the limited volume inside the electrical box, the opening to let the screen, led strip and antenna out.
So what volume do we have ?
Between the DIN rail and the outer casing of the electrical box, there's a distance of 45mm. That is the actual length (depth?) of a conventional circuit breaker (at least here in France):

The part of the breaker with the switch pops out of the box so it is easily accessible in case you need to reengage or disengage it.
So our electronics needs to fit in this 45mm. We can take more width obvisouly, but we'll try to make it small nonetheless. I designed the boards approximately at scale to see the volume I needed for the UNO, the WiFi shield and the custom PCB :

Looks like we have something like 30mm, plus the components we need to account for, and that will be soldered on the (outer) custom PCB. Not that much space left, but if fits ! ;)
The box
With that in mind, let's create a box around these guys, to hold the shields :

There's a hinge on the left, for a closing panel where the screen and leds, and the antenna hole, will be. On the sides, I left holes so I could access the USB port of the UNO and the power plug.
The big round hole on the right is for the current clamp plug (a standard jack 3.5mm).
Obviously, the oblong holes are for cooling the whole device.
Inside, I planed 4 mounting holes for M3 screws so that the Arduino board is thightly held in place :

Some parts are pink — they are supports I created in the design that help when 3D printing the case
The lid
And now for the lid. It must hold the screen, the led strip, the antenna hole, and a hole for the thermometer (so it is on the outside).
We have the dimensions for all these items, so we can define what the outer plate will look like :

On top of that, we need to add the hinge counterparts, some holes for cooling, the screw holes (M2 here) and some bevels, chamfers and fillets to be able to print the parts on a 3D printer.


To keep the 7 segment and led strip in place, I had to add another little plastic plate (in green below), screwed on the lid from the inside with M2 screws:


(view from the outside, with the lid being greyed ("transparenced") out)
Notice on the left, the hole for the thermometer. Both parts assembled give something like this :

5. The final design
After some trial and error adjustments, I came up with a relatively satisfying design :

It's quite big. But if fits in my electrical box, which was the goal. An Arduino Nano would have been enough I guess, in terms of processing power and inputs, but the shield system was more convenient with the UNO.
All the 3D files (STL) are here but you can also grab the source CATIA files in the corresponding directory in the repo. If anyone needs, I can output STEP files easily.
The last thing I decided to add was a little plastic plate in front of the displays, since they were far too bright otherwise. I laser-cutted it in plexiglas 3mm, and you can find the Illustrator file here.
So ... now let's print that "IRL", here are some pictures of the various parts (at different prototyping stages) :

the lid with its inside piece, holding the screen and the led bar

box and lid printed and mounted on a DIN rail (note it's one of the early prototype that doesnt't have all the correct holes and mounts on the lid)

the "yellow" prototype, with all the functionning electronics inside, and a far too big antenna. This was not the final version though (there is no hole for the thermometer

the "blue" final device, with the plexiglass plate and the antenna connector (sorry for the blurry shot)
While building and coding the last adjustments, I ran into some interesting things to note :
- Code size can become an issue if you don't pay attention :

Ooops, that was close! 809 bytes for local variables is not that much as well, but it works
-
The WiFi shield consumes a lot of power : I was using a cheap AC/DC and experienced unstable behaviours and frequent brownouts. As noted here, it needs a good 1A to work properly. So the whole device needs at leats 1.5A to be on the safe side
-
Sensing temperature is tricky : you need to sense it not too close from the Arduino shields, or you get wrong readings, since the shields heat up a little and confuse the sensor.
-
The CC3000 is not very resilient to network errors, so you have to account for it. It can sometimes hang for no reason, which is a pain in the a**. Note to self : it may be a better idea to transmit via simple RF the readings to a base station that is a bit more powerful and does the networking part for you.
Conclusion
All of this is open-source as usual so do not hesitate to contribute and share, improve, hijack the project : https://github.com/tchapi/Arduino-Energy-Monitor
Now what's next ? I guess miniaturization could be the next evolution, or using a base station and create multiple sensors, but then I guess I'd rather use a ready-made solution like OpenEnergyMonitor.
Interested? Drop me a line at cyril[at]foobarflies.io